
First, read in the data:
w3 <- read.table("../stats1/Stats1.13.HW.03.txt", header = T)Then, plot the histograms for all variables
par(mfrow = c(4, 2))
w3Variates <- names(w3)[sapply(c(1, 3, 2, 4, 5, 7, 6, 8), function(x) {
x + 2
})]
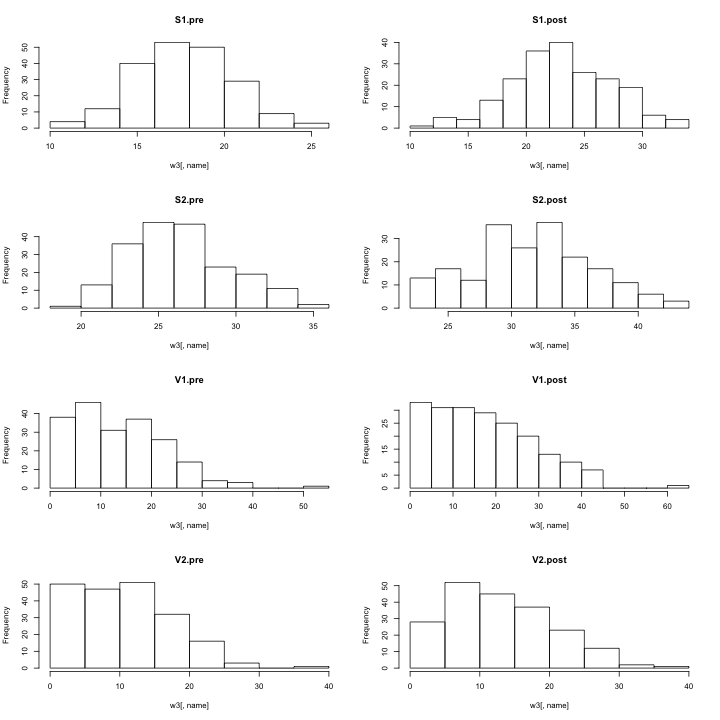
for (name in w3Variates) {
hist(w3[, name], main = name)
}
plotW3 <- function(x) {
    hist(w3[, x], main = x)
}
x <- lapply(w3Variates, plotW3)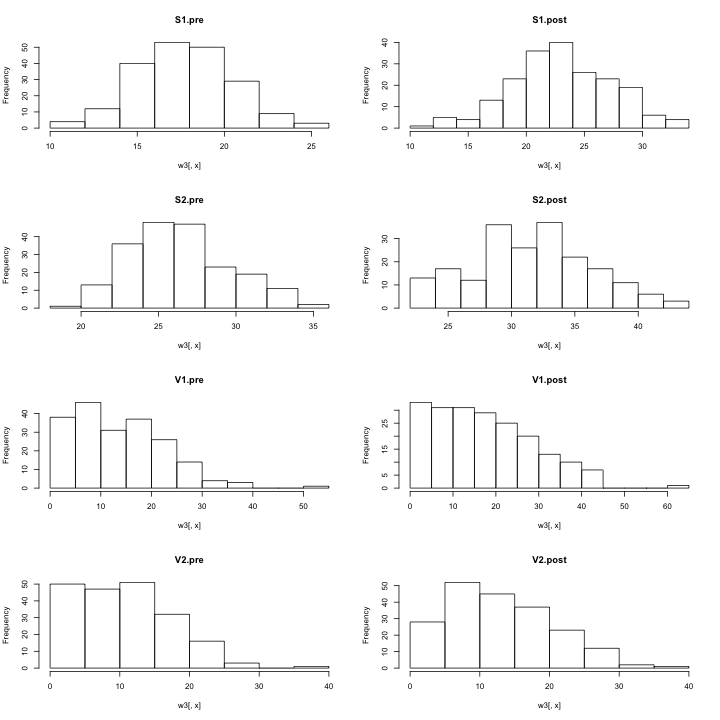
Fiddling around with types:
w3Names <- names(w3)[3:10]
as.string(w3Names[[1]])
## Error: could not find function "as.string"Reorder names:
names(w3)[sapply(c(1, 3, 2, 4, 5, 7, 6, 8), function(x) {
    x + 2
})]
## [1] "S1.pre" "S1.post" "S2.pre" "S2.post" "V1.pre" "V1.post" "V2.pre"
## [8] "V2.post"Look at variance and other:
var(w3$S1.pre)## [1] 7.837par(mfrow = c(1, 2))
barplot(sapply(w3, var, USE.NAMES = T)[w3Variates], main = "Variances")
barplot(sapply(w3, mean, USE.NAMES = T)[w3Variates], main = "Mean")## Warning: argument is not numeric or logical: returning NA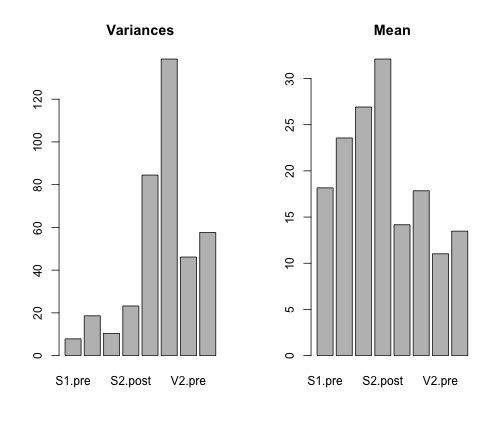
Iterate over data frame:
myDf <- data.frame(names = c("Variances", "Means", "Standard Deviation"), f = c("var",
    "mean", "sd"))
myDfPlot <- function(row) {
    f <- get(as.character(row$f))
    barplot(sapply(w3, f, USE.NAMES = T)[w3Variates], main = row$names)
}
par(mfrow = c(2, 2))
x <- by(myDf, 1:nrow(myDf), myDfPlot)
## Warning: argument is not numeric or logical: returning NA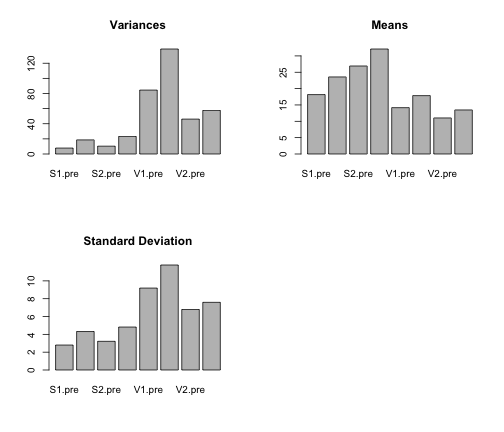
Try to figure out the basic formulas:
mean(w3$S1.pre)## [1] 18.16sum(w3$S1.pre)/length(w3$S1.pre)## [1] 18.16